
Most businesses are spending money on AI. Very few can prove it’s working.
According to McKinsey’s State of AI 2025, fewer than one in three organisations can tie their AI initiatives to any measurable change on the P&L. A further 60% have seen no enterprise-wide EBIT impact from their AI programmes, and only 15% of AI decision-makers reported any EBITDA lift in the past 12 months. The gap between AI activity and AI results has never been wider.
This isn’t an AI problem – it’s a measurement problem. Businesses are running pilots without defining what success looks like, deploying tools without redesigning the workflows around them, and reporting activity metrics (models trained, tools rolled out) instead of business outcomes (cost reduced, revenue gained).
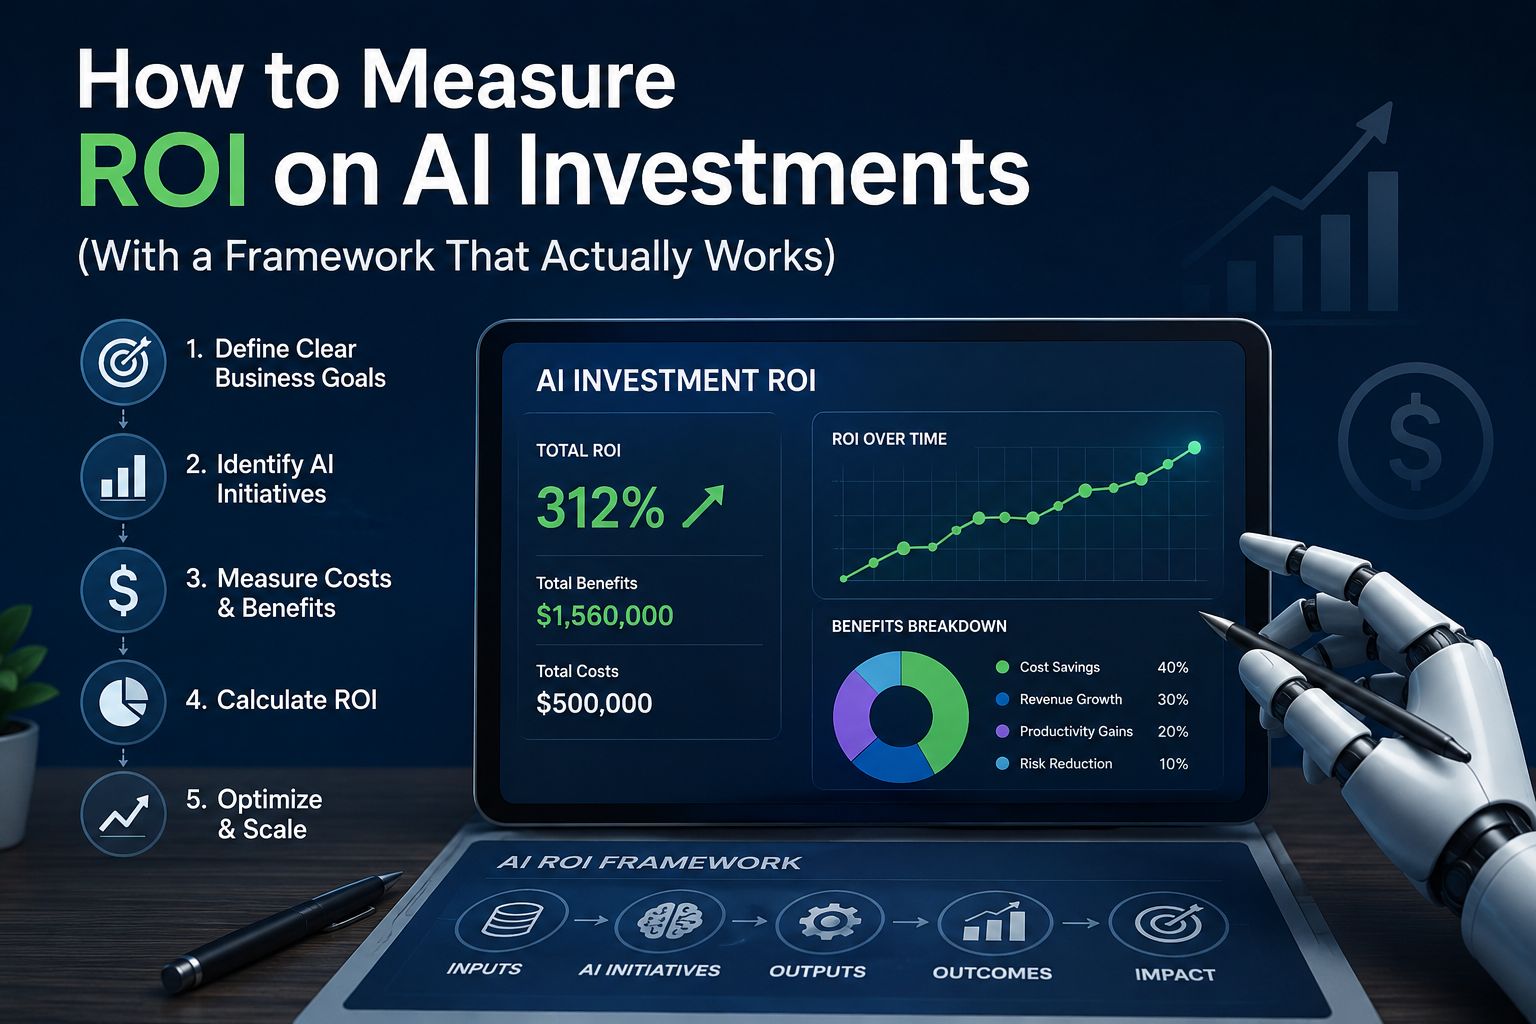
Here is a practical framework for measuring AI ROI that connects technology investment to bottom-line results.
Why Most AI ROI Calculations Fail
The mistake most organisations make is treating AI ROI like software ROI: calculate licence costs, subtract from productivity gains, declare a number. AI doesn’t work that way.
AI generates value across three overlapping layers – cost reduction, revenue generation, and strategic capability – and most ROI calculations only capture one. A business that deploys AI to handle invoice processing might save 20 hours a week in manual work, but the same AI also generates better cash flow data that finance uses to negotiate better supplier terms. Only measuring the hours misses half the value.
The second failure mode is timing. AI ROI rarely appears in month one. It accelerates as the model learns your data, as your team learns to use it effectively, and as you redesign processes around it. Measuring too early gives a false negative; measuring only early activity gives a false positive.
The Three-Layer AI ROI Framework
Layer 1: Cost Efficiency
This is the most straightforward layer and typically the first to show results. Track:
– Labour hours redirected from manual to strategic tasks (and the cost of that redeployment vs the value of what staff do instead)
– Error rates before and after AI deployment
– Processing times for workflows now handled by AI
– Cost per unit of output (cost per invoice processed, cost per support ticket resolved, cost per report generated)
McKinsey’s research on enterprise AI deployments finds that organisations typically see 20–30% cost savings in the specific functions they automate with AI. However, McKinsey is clear that these savings only materialise when AI is deployed into redesigned workflows – not bolted onto broken ones.
Layer 2: Revenue Impact
Revenue impact is harder to isolate but often larger than cost savings. Track:
– Win rates and deal sizes for sales teams using AI-assisted proposals or next-best-action guidance
– Pipeline velocity: how quickly deals move from first contact to close
– Forecast accuracy: are sales leaders making better resource allocation decisions?
– Customer retention: are AI-driven interventions preventing churn?
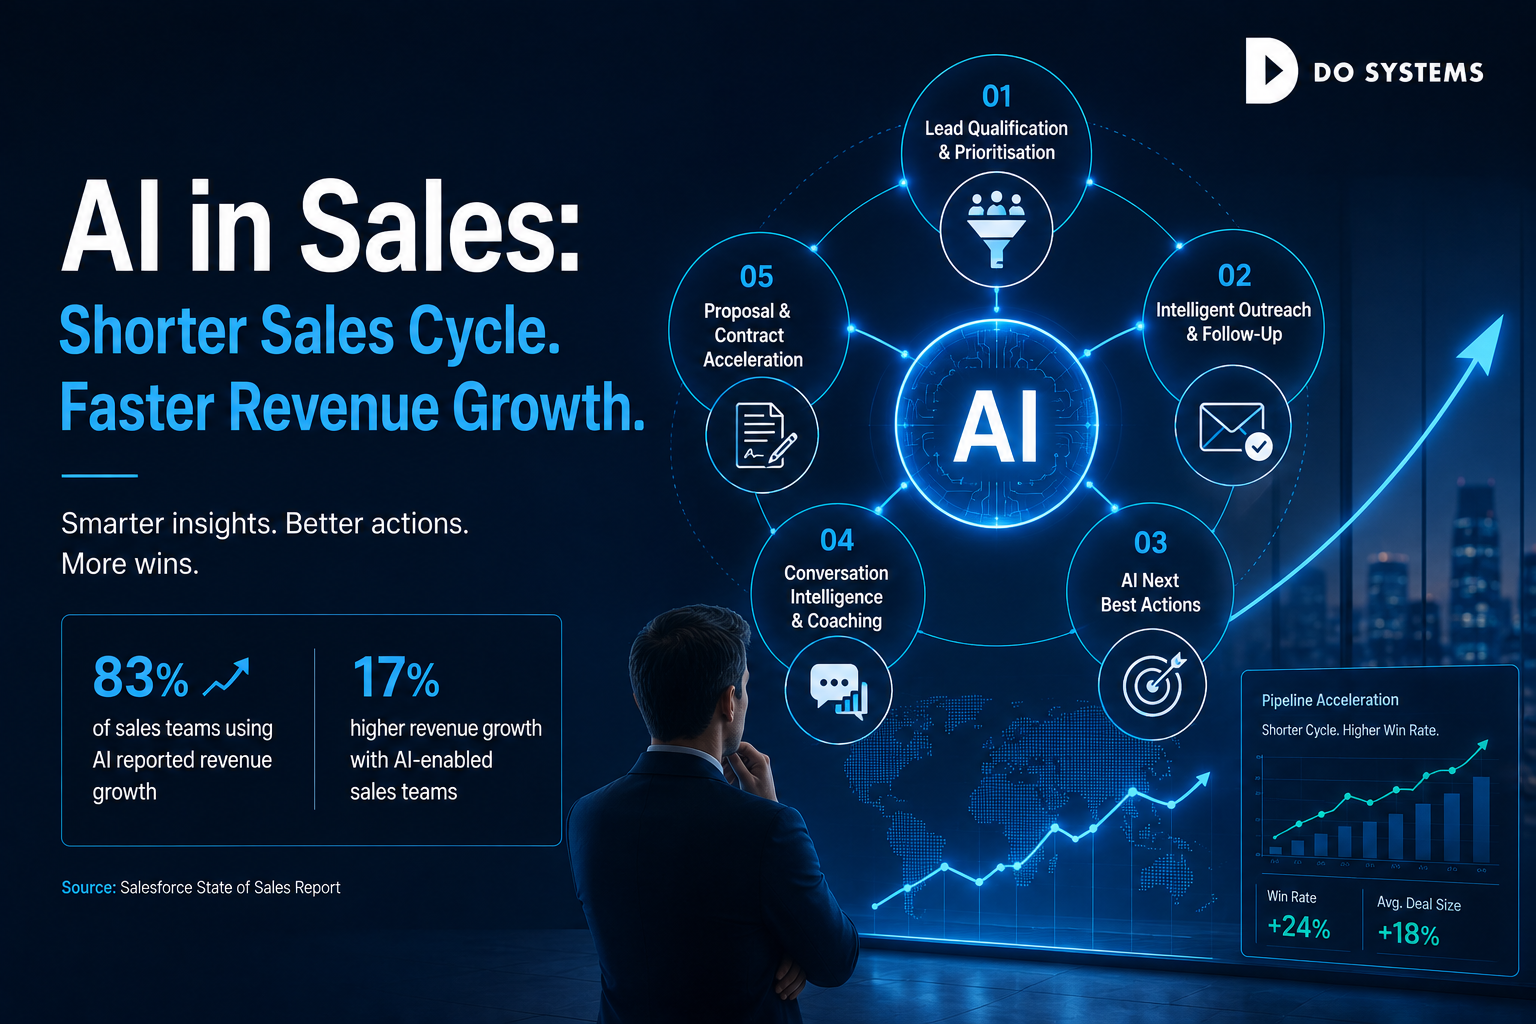
Gartner’s May 2026 research, based on a survey of 227 Chief Sales Officers conducted in August and September 2025, found that organisations deploying AI next best actions are 2.6 times more likely to achieve commercial growth than peers who have not. That is not a marginal improvement – it represents a structural competitive advantage.
Layer 3: Strategic Value
This layer is the hardest to quantify but increasingly important to boards and investors. Track:
– Decision speed: how much faster are key business decisions being made with AI-generated analysis?
– Market responsiveness: how quickly can the organisation respond to competitive moves?
– Talent leverage: how much are senior specialists able to focus on high-value work vs routine tasks?
– Data quality: is AI improving the quality of the information the business runs on?
McKinsey’s analysis of AI high performers – the roughly 6% of organisations that attribute 5% or more of EBIT to AI – finds that these companies are nearly 3 times more likely to have redesigned workflows before deploying AI technology. Strategic value accrues to businesses that treat AI as a capability transformation, not a tool purchase.
What Good ROI Looks Like
The benchmark question every leadership team asks is: what should we expect?
McKinsey’s analysis of enterprise AI deployments reports a median ROI of 210% over three years, with an average payback period of approximately 16 months. That means an investment that breaks even in just over a year and delivers more than three times the initial cost back to the business over three years.
These results are not universal. They reflect deployments where the business:
1. Started with a high-value use case, not the easiest pilot
2. Redesigned the process around AI, not just layered AI on top
3. Measured business outcomes from day one
4. Iterated the model based on real performance data
The organisations that fail to hit these benchmarks are typically those that measure AI by adoption rate – how many staff are using the tool – rather than outcome rate – what business results the tool is producing.
Building Your AI ROI Dashboard
A practical AI ROI dashboard for an SMB should have four views:
Weekly: Operational metrics – processing volumes, error rates, time saved, tickets resolved. These update frequently and give your team real-time feedback on AI performance.
Monthly: Financial metrics – cost savings realised, revenue attributed to AI-assisted activities, headcount held flat vs growth supported by AI. These feed into your P&L discussion.
Quarterly: Strategic metrics – customer retention trends, competitive win rates, decision quality and speed. These connect AI to business strategy.
Annual: Full ROI review – total investment (licences, integration, training, management time) vs total value generated across all three layers. This is your business case for the next year’s AI budget.
The Most Common Measurement Mistakes to Avoid
Measuring outputs, not outcomes. The number of documents an AI processes is an output. The cost reduction or error rate improvement it creates is an outcome. Track outcomes.
Forgetting implementation costs. Licence fees are only part of the investment. Integration work, change management, staff training, and the management time spent on the deployment all belong in the denominator of your ROI calculation.
Not establishing a baseline. If you don’t measure where you are before AI deployment, you cannot prove where AI has taken you. Establish clear baselines before going live.
Expecting linear returns. AI ROI typically accelerates over time as the system learns and your team adapts. A three-month review will understate long-term value. Plan your measurement cadence accordingly.
Frequently Asked Questions
How long does it take to see positive ROI from AI?
McKinsey’s research on enterprise AI deployments puts the average payback period at approximately 16 months, with median ROI reaching 210% over a three-year window. Simpler, focused deployments in a single function (such as customer support automation or invoice processing) can show positive financial returns within six to nine months.
Should I count staff time savings as ROI if I’m not reducing headcount?
Yes, with an important distinction. Time savings only generate ROI if the redirected time is used for value-creating activities. If AI frees a sales representative from data entry and that time goes into customer conversations that close deals, the revenue from those deals belongs in your AI ROI calculation. If freed time simply disappears into lower-value activity, the ROI is not realised. Be explicit about what staff will do differently.
What is a realistic ROI target for a first AI deployment?
For a well-scoped first deployment in a high-volume operational function, a realistic expectation is 30–60% cost reduction in that specific function within 12 months, with payback achieved in the 12–18 month window. McKinsey’s data suggests companies focusing AI on a small number of high-impact use cases see stronger EBITDA uplift than those spreading AI broadly across many low-impact applications.
Comments are closed