
There is an enormous amount of AI investment happening with no clear measurement of what it is returning.
Deloitte’s 2026 State of AI in the Enterprise report drawing on 3,235 senior leaders surveyed between August and September 2025 found that 66% of organisations report productivity and efficiency gains from AI. But only 20% are growing revenue through AI, and fewer than one in three can measure their AI ROI with confidence.
That gap is not a technology problem. The AI is working. The measurement design is not.
McKinsey’s research identifies a similar pattern: 88% of organisations use AI in at least one business function, but only 6% qualify as AI high performers defined as attributing 5% or more of company-wide EBIT to AI. The high performers are not necessarily using more sophisticated AI. They are measuring differently.
This guide gives you the measurement framework that separates organisations that know what their AI is returning from those that are running on assumption.
Why Most AI ROI Measurement Fails
The most common AI measurement failure has a specific structure: teams measure inputs and activities rather than outputs and outcomes.
Inputs and activities: number of AI tools deployed, number of employees using AI, hours of training delivered, number of processes automated. These measure adoption, not value.
Outputs: tasks completed per hour, documents processed per day, tickets resolved without human intervention. These measure efficiency, which is useful but incomplete.
Outcomes: revenue generated, cost reduced, risk reduced, customer retention improved. These are the metrics that connect to business value — and they are where most AI measurement stops short.
Reporting that ‘200 employees are now using AI tools’ to a leadership team asking about ROI is a mismatch. The result is either pressure to produce ROI numbers that have not been measured properly, or growing scepticism that AI is delivering value at all.
Deloitte’s finding that fewer than one in three organisations can measure AI ROI with confidence despite widespread deployment is a direct consequence of measurement designs that track adoption rather than value.
The Three-Layer Measurement Framework
Build your AI measurement framework in three layers, each requiring the previous layer to be complete.
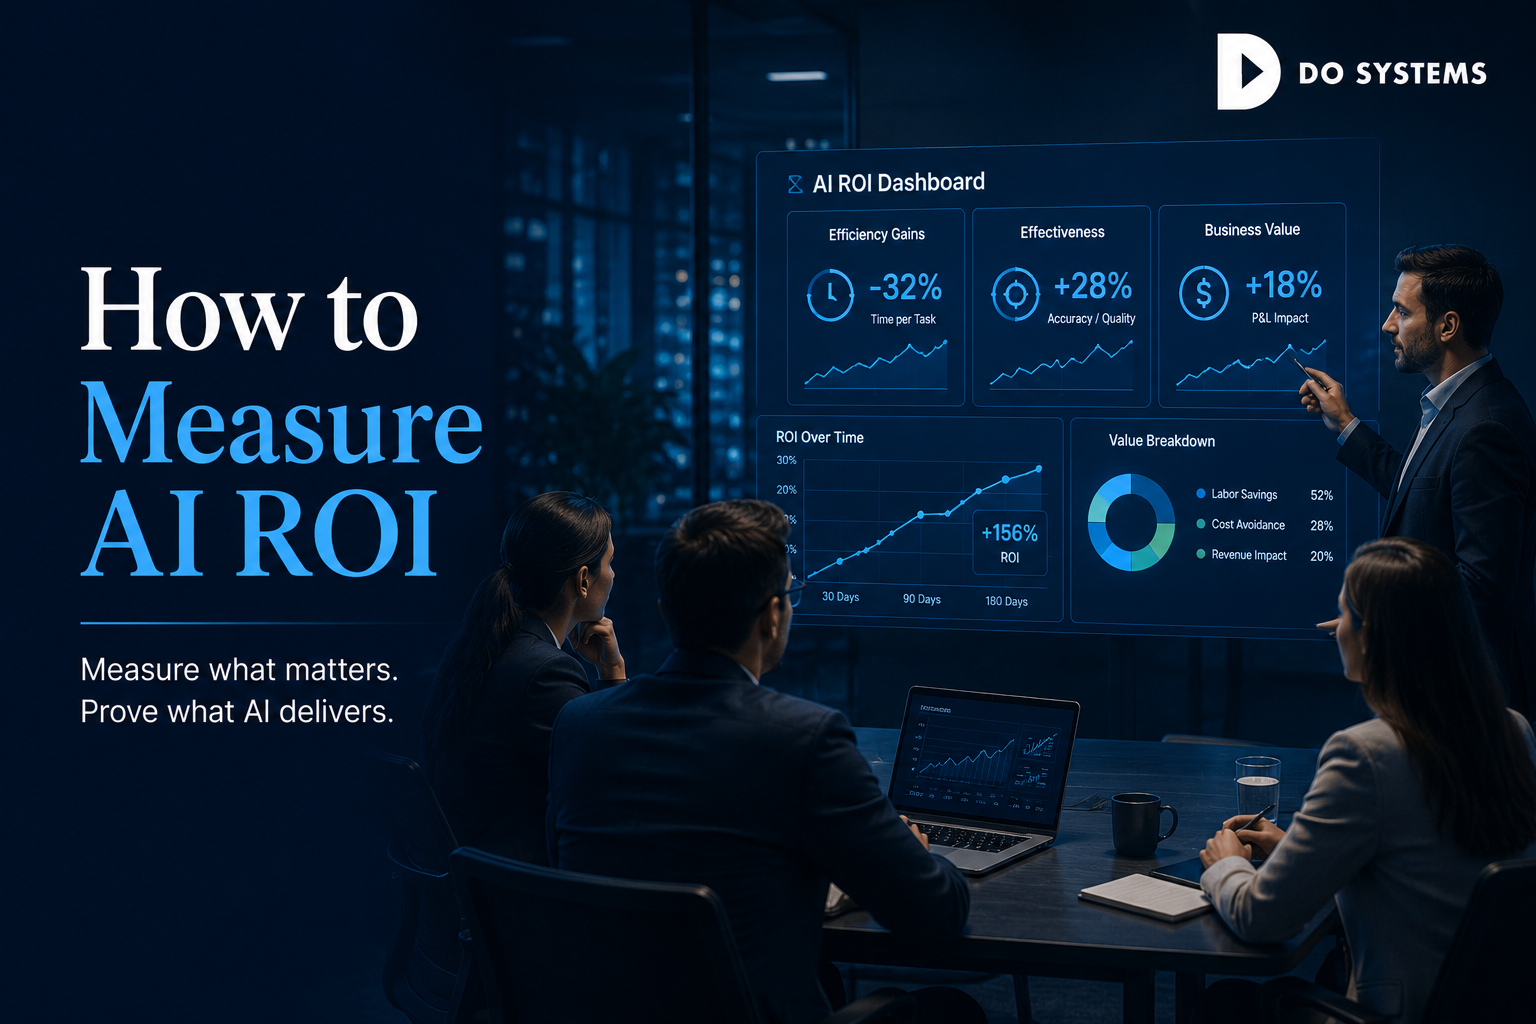
Layer 1 — Efficiency (Did AI make the process faster or cheaper?). This layer measures the direct operational impact of AI on a specific process. Metrics: time per transaction before and after AI deployment, cost per transaction before and after, error rate before and after. This is the baseline layer — every AI deployment should have it. Without a pre-deployment baseline, you have no denominator for your ROI calculation.
Layer 2 — Effectiveness (Did the process outcome improve?). This layer measures whether the AI-assisted process is producing better results, not just faster results. For sales AI: conversion rate and deal size, not just time-to-proposal. For customer service AI: CSAT and resolution rate, not just deflection rate. For finance AI: forecast accuracy, not just close cycle time.
Layer 3 — Business value (Did it move a metric that matters to leadership?). This layer connects the process improvement to P&L, risk, or competitive position. Cost reduction that flows to margin. Revenue impact from faster sales cycles. Risk reduction that flows to insurance premium or regulatory standing. This is the layer that makes the ROI case to a CFO or board — and it requires the efficiency and effectiveness layers to be established first.
Metrics by Function
These are the Layer 3 business value metrics by function that AI high performers track.
Sales and revenue operations: revenue per sales rep per quarter (does AI increase output per rep?), pipeline conversion rate (does AI lead scoring improve win rate?), average sales cycle length (does AI accelerate time to close?), customer acquisition cost (does AI reduce the cost of acquiring each customer?).
Finance: days payable outstanding and days sales outstanding (does AP and AR automation improve cash flow?), month-end close cycle time (does AI reduce close duration?), forecast accuracy variance (does AI improve CFO forecast reliability?), audit finding rate (does AI reduce compliance exceptions?).
Customer service: cost per resolved ticket (does AI reduce the cost of each resolution?), customer lifetime value by service channel (does AI service quality affect retention?), net promoter score by channel (does AI affect the customer’s likelihood to recommend?).
IT operations: mean time to detection and mean time to resolution (does AIOps improve incident response speed?), infrastructure cost per unit of compute or storage delivered (does AI optimisation reduce spend?), change-related incident rate (does AI-assisted change management reduce deployment failures?).
How AI High Performers Measure Differently
They establish baselines before deployment, not after. The inability to demonstrate ROI is almost always traceable to the absence of a pre-deployment measurement of the same metric. High performers treat baseline measurement as a deployment prerequisite.
They select metrics at the business value layer, not the efficiency layer, as the primary success criterion. Efficiency metrics are diagnostic — they tell you whether the AI is functioning as designed. Business value metrics are the actual success criterion. High performers define the business metric they expect to move before deployment begins.
They measure at 30, 90, and 180 days with different expectations at each milestone. 30 days: is the system processing accurately? 90 days: is the process outcome improving? 180 days: is the business metric moving? This staged approach prevents premature conclusions in both directions.
They assign measurement ownership to a business stakeholder, not the IT team. When ROI measurement is owned by the team that deployed the AI, there is an inherent conflict of interest. High performers assign measurement to the business function that owns the outcome — the CFO for finance AI, the VP of Sales for sales AI.
Frequently Asked Questions
What is a good AI ROI benchmark?
Benchmarks vary by use case and function. McKinsey’s research on AI in finance identified high performers achieving $10.30 per dollar invested. Forrester’s research on workflow automation documented 248% three-year ROI. IBM’s security research found organisations using AI and automation saved $1.9 million per breach. Use these as directional benchmarks your ROI depends on your baseline cost structure and implementation quality.
How long does it take for AI to show measurable ROI?
Efficiency-layer ROI (process speed and cost) typically appears within 30-90 days of a well-implemented deployment. Effectiveness-layer ROI (improved outcomes) typically shows at 90-180 days. Business-value-layer ROI (P&L impact) typically requires 6-12 months to measure reliably, because the business metrics involved have longer measurement cycles.
What should I measure if I am just starting with AI?
Start with the specific process you are automating. Measure: time per transaction before you start, cost per transaction before you start, and error rate before you start. These three numbers are your baseline. Then measure the same three metrics at 30, 60, and 90 days post-deployment.
Should AI ROI include productivity gains from employees?
Yes, with appropriate methodology. Productivity gains hours saved per employee per week should be converted to a monetary value using fully-loaded cost rates and then discounted to account for the fact that time savings do not automatically convert to output gains. A rep who saves four hours per week delivers value only if those hours are redirected to higher-value activity. Build that assumption explicitly into your ROI model.


Comments are closed